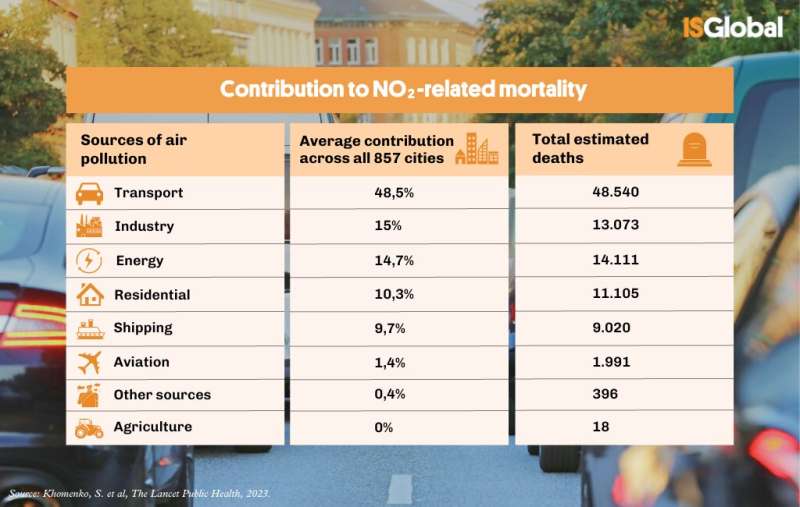
Contribution to NO2-related mortality. Credit: ISGlobal
Air pollution is the leading cause of environmental death. Now a study led by the Barcelona Institute for Global Health (ISGlobal), a center supported by the “la Caixa” Foundation, has estimated which sources contribute most to mortality associated with two air pollutants – PM2.5 and no2– in 857 European cities.
The results of this research, which have been published in The Lancet Public Healthshow a large variability between the different cities studied, suggesting that since each city has its own peculiarities and its own sources of air pollution, strategies to improve air quality need to be adapted to each local context.
Contributors to PM2.5 mortality
Putting together the data for the 857 cities, the numbers show that the largest contributor to PM2.5 mortality is emissions from residential sources, with an average contribution of 22.7% for all cities. In second place is the agricultural sector, which accounts for an average of 18% of PM2.5 mortality, followed by industry (13.8%), transport (13.5%), energy sector (10%), natural resources (8.8%) and shipping (5.5%).
“If we look at NO2 and PM2.5 combined, traffic remains the biggest cause of both poor air quality and associated mortality. However, if we look exclusively at the PM2.5-related mortality, we see a significant contribution from the residential sector and agriculture,” said Sasha Khomenko, ISGlobal researcher and first author of the study.
“While we did not break down the specific sources of emissions by sector in our study, we know from the scientific literature that the majority of particulate matter generated at the household level is mainly due to biomass and coal combustion for heating and , to less fossil fuel based systems for heating and hot water generation and gas stoves,” explains Khomenko. “We know that rising fossil fuel prices and policies to combat climate change have led to an increase of the use of biofuels. However, the fact that they are products of natural origin does not mean that they are not harmful to health,” she adds.
“With regard to agriculture, intensive livestock farming is known as an important source of particulate matter, which is mainly caused by ammonia in animal slurry and also by the use of certain fertilizers. It is a source of pollution that spreads from its place of origin and moves to nearby cities,” she says.

Contribution to PM2.5-related mortality. Credit: ISGlobal
P.M2.5 particulate matter is the air pollutant with the greatest negative impact on mortality in European cities. The team emphasizes that more research is needed to determine which components of PM2.5 particles are the most harmful to health, so more precise mitigation measures can be designed.
NO2 is a gas generated in combustion processes, mainly of motor vehicles, but also in industrial or power generating plants.
“More bold measures are needed to drastically reduce pollution and deaths from traffic, which remains the main source of emissions. While implementing policies to reduce the other sources of both NO2 and PM2.5 emissions, such as regulating emissions from industry and shipping, and limiting biomass burning in households and emissions from agriculture and livestock,” said Mark Nieuwenhuijsen, director of ISGlobal’s Urban Planning, Environment and Health Initiative.
“To reduce air pollution, we need multi-sector holistic action and solutions, for example with task forces on current silos (e.g. urban planning, transport engineering, housing, environment, health, education, agriculture, business) at city, national and EU level” , adds Nieuwenhuijsen.
Methodology
The study focused on 857 European cities included in the Urban Audit 2018 dataset. Baseline NR2 and PM2.5 2015 emissions data were obtained from the Copernicus Atmosphere Monitoring Service regional inventory and classified into 12 sectors using a standard nomenclature system (GNFR). In addition, population and mortality rates for the 857 cities were obtained from public databases, also for the year 2015.
To estimate the contribution of each emission source to the concentration of pollutants in the atmosphere, the researchers used the Screening for High Emission Reduction Potentials for Air quality (SHERPA) tool developed by the European Commission’s Joint Research Center (JRC). . This tool applies the principles of chemical transport models in a simplified way. These models take into account factors such as meteorology or chemical transformations to simulate the concentration of pollutants in the atmosphere.
The research team divided the surface area of the studied European cities into 36 km2 grids. Using SHERPA, they estimated the changes in atmospheric concentrations of PM2.5 and no2 this would happen if the emissions in each of the grids on the map were reduced and the relative contribution of each of the pollution sources calculated.
Finally, a comparative risk assessment was performed to estimate the mortality that could be prevented under different scenarios of reduced pollutant concentrations associated with each of the emission sources.
It should be noted that, due to the spatial resolution of the study, estimates for smaller cities may be less accurate than those for larger cities.
More information:
Spatial and sector-specific contributions of emissions to air pollution and mortality in European cities: a health impact assessment, The Lancet Public Health (2023). DOI: 10.1016/S2468-2667(23)00106-8
Quote: Transport, household activities, agriculture are the main causes of air pollution mortality in Europe: study (2023, 29 June) retrieved 30 June 2023 from https://medicalxpress.com/news/2023-06-domestic-agriculture-main contributors-air.html
This document is copyrighted. Other than fair dealing for private study or research, nothing may be reproduced without written permission. The content is provided for informational purposes only.